PMS Survey Results

Yes Consulting carried out a survey a couple of months ago to elicit responses from short-term rental managers with respect to pricing and their gripes when using their PMS.

THE CHALLENGE
This part of the industry is well known for its challenges. Few managers work the same way; all have minor or major variations, and thousands of edge cases make for challenging product development. There are hundreds of PMS systems, a few have seen significant investments recently (Guesty and HostAway), and a few have been acquired (Avantio, for example). These companies must grow and repay their investors: Saas returns are therefore important, as you will appreciate by the number of emails many managers receive. But so is value for money for managers and hosts.
There is also a raft of genius third-party service tools that require access to the booking channel but are carefully guarded and billed by PMS systems as the gatekeepers. We hence had three issues of substance that we wished to address. These questions have been gleaned from numerous conversations and presentations around the world. They are:
- Assuming it does the job, what is a good price-wise value proposition with a PMS?
- What are the complaints that most managers have related to their PMS?
- Is there discontent among customers and suppliers who wish access to third-party services and extra distribution?
The summary results of the survey are shown below. However, it is obvious that despite seeing an inventory of over 10,000 properties from 300+ managers, the survey size needs to be much more significant to rationalise by geography, type of manager and business type (see summary).
28+ PMS SYSTEMS
Despite the constant grumbles from managers, many businesses were satisfied. In a way, it resembles guest reviews. It's easier to complain and may explain the verbal approach! No particular PMS was a winner from those submitted (28 systems and some unnamed). It appears that what suits one does not suit another.
Very Dissatisfied | 3.8% |
Dissatisfied | 15.9% |
Satisfied | 55.8% |
Very Satisfied | 28.4% |
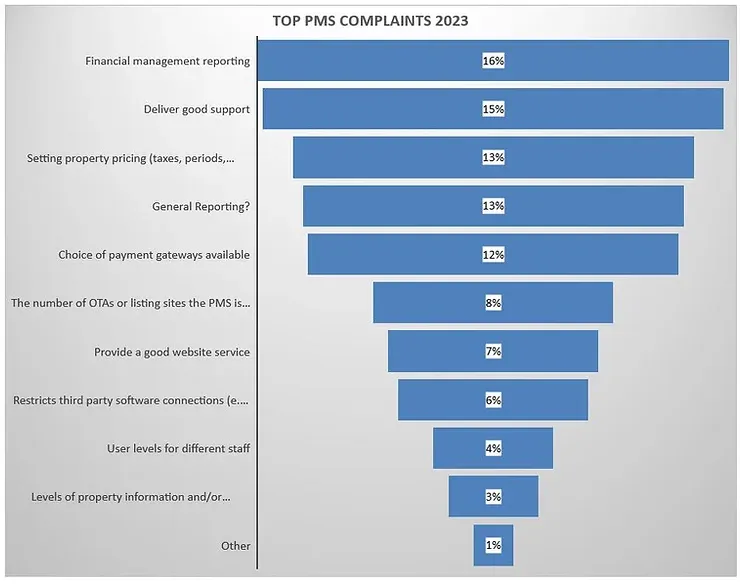
TYPE OF COMPLAINTS: No real surprises on this one. Financial Reporting and General Reporting, close to 30% between them, closely followed by support, which is also a challenge in a world of non-standard data exchange, variable business practices and a need to keep costs down.
RESTRICTIONS
Only 6% complained of a restriction on third-party app access, and 7% a good website service. Both were surprising to a degree, but it may well be "they don't know what they don't know" as the industry appears to have limited visibility/reach into the market at large, and the gatekeeper for most users is the PMS.
The suppliers and developers of specialist rental tools often complain about restrictive practices on connections to the booking information, which must dilute the marketing ROI of these businesses. There is an opportunity here for networking data and booking information from one company to another (with attention to permissions and GDPR).
PAYMENT METHODS
The following is how the respondents pay for their PMS currently.
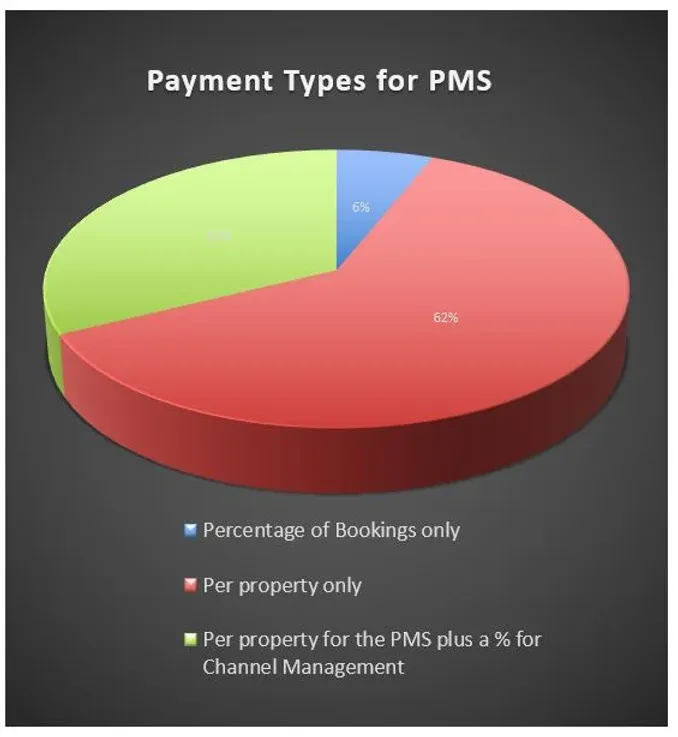
Certainly, from conversations, the preferred route for billing is a single per-property amount, as it can be budgeted with no unforeseen penalties for a fantastic season.
KEY STATISTICS
These are a few summary numbers from the respondents that are fairly self-evident.
A note on the respondents: Each could reply in their currency ($,£ or EU). The current exchange rate is $100 is £80 or EU92, a 20% and an 8% difference. Hence the number shown below in the table reflects the averages and is rounded up (or down).
£7-EU8-$9 | A fair price to pay per property per month for all services. Averaged across all respondents by inventory. The most dissatisfied were happy to pay £10/11EU/$12, and 19% of all respondents were willing to pay over 20 of any currency. |
37.65 | The average number of properties from all who completed the survey |
11% | The number of respondents who wanted a commission only |
50% | The number of commission-only respondents who suggested 0.1 to 0.5% |
25% | The number of commission-only respondents who suggested 0.6 to 1% |
25% | The number of commission-only respondents who suggested 0.1 above 1% |
There is absolutely no doubt that the expectations of managers are wildly different from case to case, but the highest prices (20+) were predominantly US based. This may well reflect the higher living cost for software developers in the USA or the fees charged by managers to owners. Europe/UK appears more competitive.
The short-term industry is alive with edge cases. Not every manager or agency works the same, which is why we probably see a number of "managers" wishing to adopt a % commission approach only. Imagine having 1000 properties that are not exclusive or a franchise with many thousands of properties but are taking a much smaller percentage of the booking. In the first case, the business may specialise in a niche market and act as a secondary channel. Without complete distribution control and exclusive contracts, this will make for fewer bookings, and hence a percentage is much more attractive than paying for 1000 properties with only a few bookings per month.
Mailing Lists vs Inventory
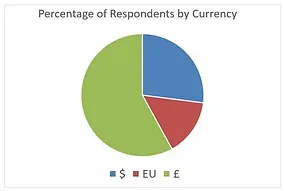
As noted in summary below, distribution lists, traction, timing and loyalty come into play in any analysis of replies. As can be seen, by this image, there is a high percentage of UK respondents.
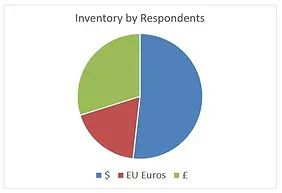
However, the number of properties represented differs, with North America being the largest contingent. This reflects the smaller managers and some hosts who replied too. However, 75% of all UK inventory was from managers (10+ props), 86% in the US and 97% in Europe.
SUMMARY
Despite a very aggressive mailing campaign, it is clear to make a very detailed analysis requires a market-by-market approach based on the following.
- Manager size,
- Type of business (urban/leisure)
- Location/Geography
- Business activity (exclusive, agency, franchise etc.)
- Commission structures
Large leisure destination managers are more challenging than small urban managers, and the latter is presumably the target of volume sales for the PMSs with marketing momentum.
Larger clients are also more demanding on websites, which poses secondary headaches for PMS companies. Certainly, financial management and reporting are poorly supported from what we see and in conversations with managers. Price and support are the other factors raised constantly in conversation and illustrated above.
The single most significant takeaway is that there is no standard price to adopt and run a PMS, and it is evident that a lot of research needs to be undertaken before adopting a PMS or changing suppliers. The price is likely to be negotiable as the spend on marketing increases and user volume is demanded. Larger management companies are also increasingly aware of the sizeable capital spent once their business hits a certain threshold.
The last takeaway is that some respondents (predominantly the larger) have developed their own PMS and channel connections (direct & via a Channel Manager) and can manage their own future. This is a subject that growth companies address continuously, but at some point, big generally means taking control of your destiny and not being hampered by third-party politics and refinements of processes.
HELP IS AT HAND:

We have created a PMS calculator to evaluate a PMS supplier's cost per month per year, cost per property and more.

This is a link to a document that advises on what to address when adopting a PMS. Many pages are filled with questions that should be answered before signing on the dotted line! Over 500 downloads to date, including a number of PMS companies!
Thanks for helping with distribution; go to:
- RentalScaleup and Thibault Masson (our newsletter of choice)
- Scale Rentals organisation (well worth attending)
- PASCUK (Join this UK Association, it has so much value!)
- Yes Consulting (the admin to this site)